
With the amount of complex reporting and analytic tools in the digital marketing space reporting is becoming more and more inaccessible. With this in mind i’ve created a guide exploring the array of reporting tools, and how you might combine them to make the most out of your data.
Classifying reporting tools
When learning about different reporting tools, I think often the largest hurdle is knowing which tools you should use and where.
In the figure below I’ve categorised tools I think are essential to reporting in the digital marketing space.
I would argue comprehensive reporting encompasses:
- In platform tools encompass those used directly in ad manager platforms
- Analytical tools include those that track website behaviour
- External reporting tools include tools you may use in addition to the above to give a topline view of performance.
Here’s examples of cases for each
| Category | Reporting tools | Use |
| In Platform tools | Google Ads Reports & DashboardsMeta Reports LinkedIn ReportsReddit ReportsTik Tok Reports | Should use to monitor account performance, and consult before making account changes |
| Analytics | Google Analytics (GA4)Adobe Analytics | Use as a ‘source of truth’ to monitor how platforms are performing in tandem. Use to expand insights and monitor how platforms/ campaigns affect engagement behaviour onsite |
| External Reporting | Looker StudioSwydoFunnel.io, Tableau, Domo, Datorama | Mainly used for cross-platform reporting. Can also be used to simplify & share data with wider teams. |
To make these categories more tangible we’ll go onto explore an example for each detailing how you might use each tool and combine them to get more out of your data.
1. Exploring In-platform tools and their limits
Example 1: Google Ads: Reports & Dashboards
Google Reports and Dashboards are a great way to quickly organize your data and visualise what’s going on in your account. With simpler account set ups, Google’s own reporting features are often all you need to monitor performance.
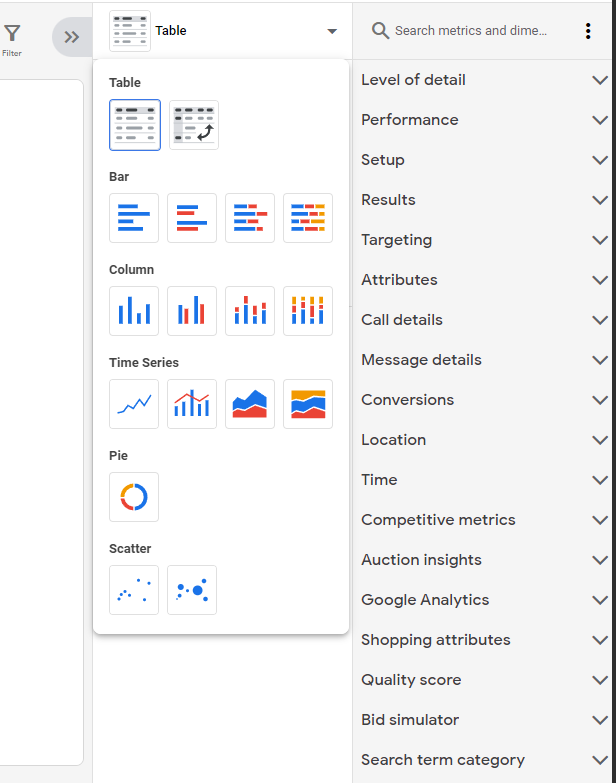
Here, you can use pre-set reports, or create and save your own. When creating your own reports, Google provides a range of graph types and metrics to play with!
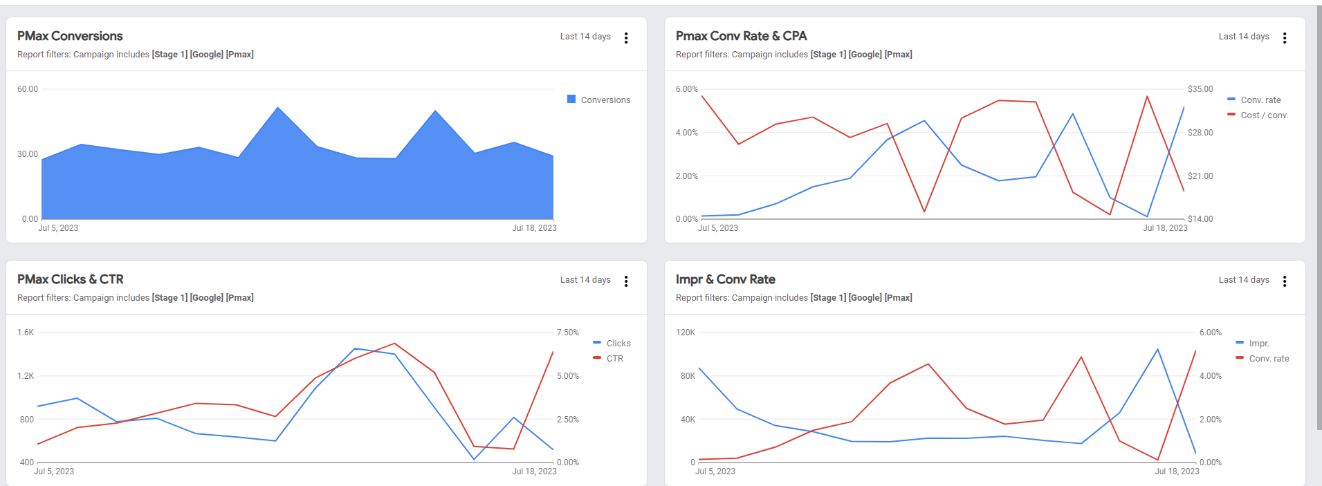
You can also insert saved reports into a dashboard and view data important to you regularly, either with a preset schedule (emails prompting you and/or collaborators to review the dashboard) or within the ads interface.
So why combine with another platform?
Although Google Ads reporting features can be great, there are limitations that other tools can help mitigate. these include:
- Not being able to plot certain metrics against one another
- If you had multiple conversion actions and wanted to view a metric like cost/conversion for each one, Google wouldn’t allow you to. Here you’d have to rely on manual formulas in excel, or use an external reporting tool (more on this later 😊)
- There’s room for attribution errors / limited accuracy
- Google is selfish and likes to attribute more than is owed. For example, if a user came across an Instagram advert and later went to Google your brand and purchase something, Google would take all the glory. This means conversion numbers can be inflated, particularly if you are advertising across platforms. Here using analytics can help bridge the gap.
- You can’t combine data with internal systems / platforms outside of Google
- When you have accounts across platforms, a centralised reporting system is best to gain a quick snapshot of overall performance.
- Viewing comparison metrics by campaign / ads is less intuitive
- Perhaps this is a personal preference, but why sift through a table for percent change when other applications lay it out for you!
These limits apply to a majority of ad platforms (including Meta and Tiktok). Infact some limits such as reporting abilities / data accuracy become more limited as we move to other platforms.
2. Analytics: Combining onsite learnings with marketing
GA4: Google Analytics 4
Google analytics is an analytical and reporting software that allows you to accurately map data from marketing platforms all the way through to user journeys onsite.
Essentially, it’s a referee in the game of marketing. Unlike in-platform reporting tools that take all the credit for each conversion, Google analytics give a relatively fair conversion value to each platform.
Analytics also allows you to monitor user journeys onsite and pull related metrics. These include metrics associated with user acquisition, onsite journeys, landing page and engagement metrics. Often in-platform tools will skip the middleman, telling us we’ve converted onsite, but not how or where. Using GA, we can monitor where people drop off, and work to improve conversion rates internally by ‘fixing leaks’ onsite.
You may be thinking, how does GA fit in with other tools, and why not just use GA if it contains all this information?
- Algorithms work to their own data
- marketing platforms work to their own data – even though numbers may be inflated, it’s always best to make decisions with ad platform metrics in mind.
- You don’t want to miss Important metrics
- GA4 is great in linking data from marketing platforms to site but lacks insight into more niche metrics marketing platforms algorithms prioritise (i.e. impression share, auction insights, quality score, keywords).
- Impression data is only available for Google
- GA4 doesn’t consider Impressions outside of google in a user’s journey – for example, if someone views a video from facebook, and later converts on site via google search, GA4 will not have the data on that video view. This is why it’s important to use in-platform data in combination.
- Reporting can be tricky
- Another issue with GA4 is simply accessibility. With the complexity of GA4 pulling useful information requires a good understanding of the platform and its rules of scope.
Again, these limits apply to other analytical platforms and should be considered.
3. External Reporting: An intuitive and centralised reporting system
Googles’ Looker studio.
Looker studio can be a great application to report with, it provides clear, intuitive graphics / tables, and allows you to connect whichever data source you / your client utilise as a ‘source of truth’ (It’s also free!!). I would recommend utilising the platform to connect to an internal data source, this would enable you to monitor conversions according to your/ your client’s systems.
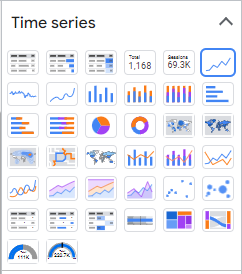
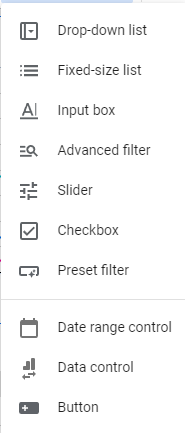
The application offers a range of charts and interactive widgets and allows you to create and format metrics so you can build a dashboard personalised to you – it can be as complex or simple as you’d like!
So… why not just move to Looker studio?
– Differences in data
- Depending on which data source you connect – there can be mismatches between the data displayed in data studio, and the data we see in advertising platforms – whether that be a result of tracking errors or attribution discrepancies. Point being, algorithms driven by advertising platforms work to their own data, it’s always best to check this data and use it to inform any account adjustments you make.
– You don’t want to miss Important metrics
- GA is great in linking data from marketing platforms to site but lacks insight into more niche metrics marketing platforms algorithms prioritise (i.e. impression share, auction insights, quality score, keywords).
Piecing it all together
In platform
✓ Can gain an overview of niche metrics (i.e. quality score, ad strength, expected CTR) ad platform algorithms utilise
✓ Allows you to see numbers algorithms work toAllows you to see numbers algorithms work toAllows you to see numbers algorithms work to
× Data may not be completely accurate – attribution errors / tracking limits (particularly for meta)
× Can be reporting limits
Analytics
✓ Can combine marketing and onsite insights. If there’s a particular drop off point onsite, you can identify it and work to ‘fix leaks’ deep into the customer journey
✓ If set up correctly, it is a useful source of truth
× Requires some technical understanding
× Can’t map niche metrics algorithms use
× You should always refer back to in-platform data
External reporting
✓ Can work to a business’s source of truth
✓ Can be a comprehensive reporting tool, allowing cross-platform reporting
✓ Can create complex or simple visualisations to give a topline view of reporting
× Can’t map niche metrics algorithms use
× You should always refer back to in-platform data
As we’ve explored, there’s no perfect reporting option – but using a variety of tools can help you get a detailed understanding of your account / campaign’s performance at ad level through to onsite behaviour.
If you want to know more, have any questions, or need help with reporting, get in touch!