
This guide walks through blending data in Data Studio so that you can break a single conversions metric out into several individual conversion actions, display them side by side, and calculate a cost per conversion for each one. Google Ads and Microsoft Ads report every conversion under one figure by default, so blending is the practical way to isolate specific actions (for example an offline lead form) and report on them separately.
What you will end up with
- A basis (core) table that carries your overall figures, such as total cost.
- One filtered table per conversion action you want to isolate (up to five in total).
- A blended data source that joins them together on a shared dimension, usually date.
- A calculated field that returns a clean cost per conversion for each action.
Step 1. Connect your data sources
Connect the relevant sources to your dashboard. Google Ads and Microsoft Ads both connect natively in Looker Studio. For Meta and other platforms that are not native, use a third party connector such as Power My Analytics to bring the data in.
Step 2. Create a blend
Once your sources are added to the account, you need to create a blended source. Go to the Resources tab and open Manage blends, then choose Add a blend. Don’t forget to name it, from experience it can be hard to find if you have 10+ called blended data…

Step 3. Set up the basis (core) table
The blend editor opens with your first table already in place. This first table is your basis dataset, and its job is to hold the core overall numbers you always want available, such as total cost. Select the data source you want to use as the basis.
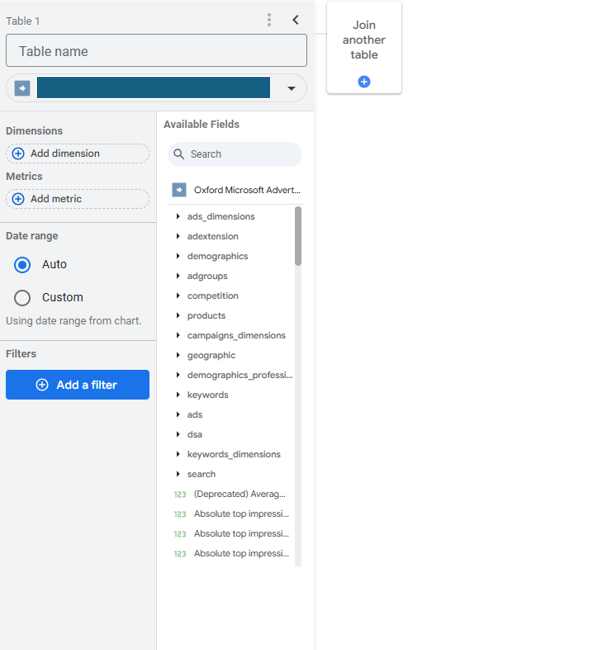
Now add the metrics you care about, for example total cost. Crucially, include a dimension that will let you join another table to this one, so date is important. Name the table something clear, and rename the metrics so it is obvious they come from the basis dataset. In this example the metric has been prefixed with "Total".
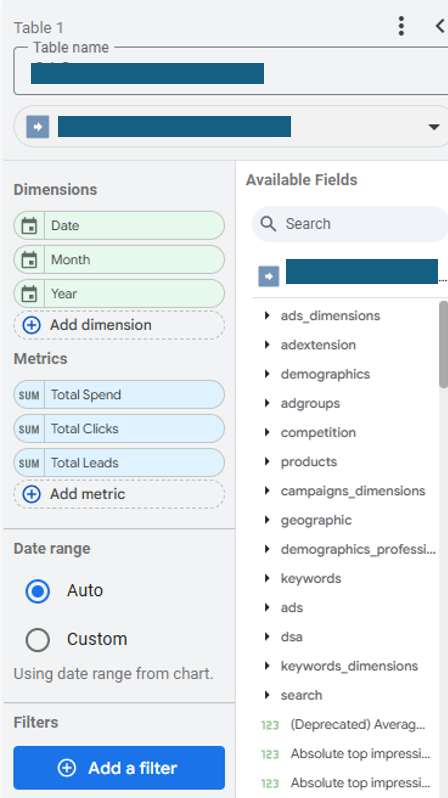
Step 4. Join a second table on the same data source
Add another table and select the same data source again. Set the join configuration to Full outer, then match up the relevant join conditions so the two tables line up. Because you are joining on date, set date as the condition on both sides.
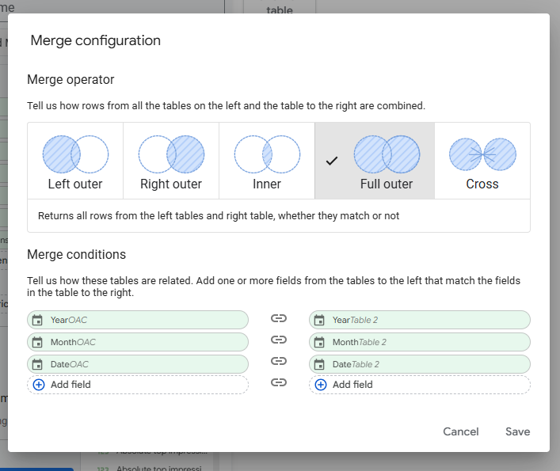
A full outer join keeps every row from both tables even where one side has no matching data, which prevents rows being silently dropped and keeps your totals accurate.
Step 5. Add the conversion metric to the second table
In the second table, add the metric you care about. In this case the aim is to build a custom column for one particular lead form. The table has been named to reflect that. At this point, however, the conversions metric still counts every conversion, so the next step is to isolate the one you want.
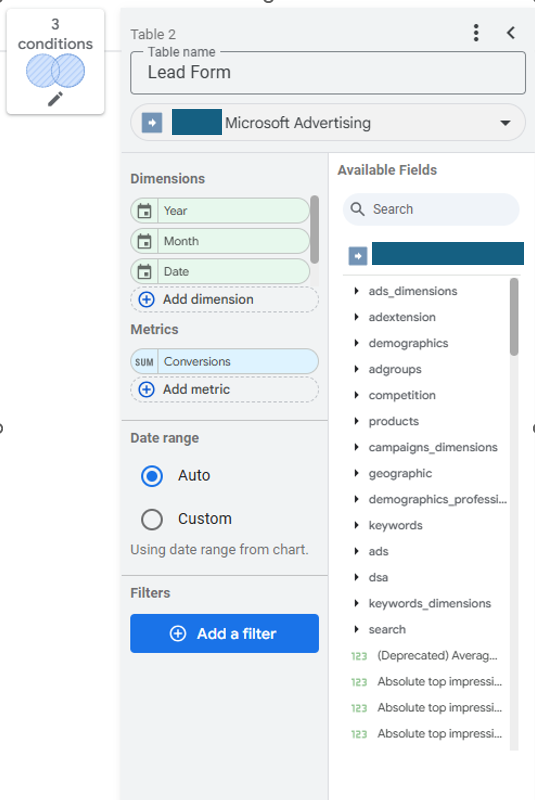
Step 6. Filter to the conversion action you care about
Add a filter to this table so it only counts the conversion action you want. Choose Include, search for the conversion type field (it may be labelled conversion action), set the condition to Equal to, and search for your specific conversion action.
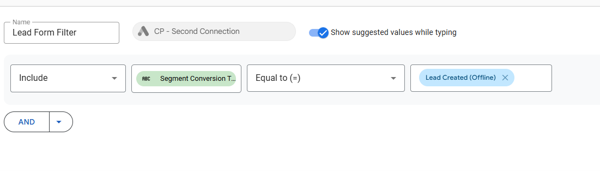
The filter: Include, conversion action, Equal to, then the specific action you want to isolate.
The process is identical in Microsoft Ads, except that Microsoft refers to a conversion action as a Goal.
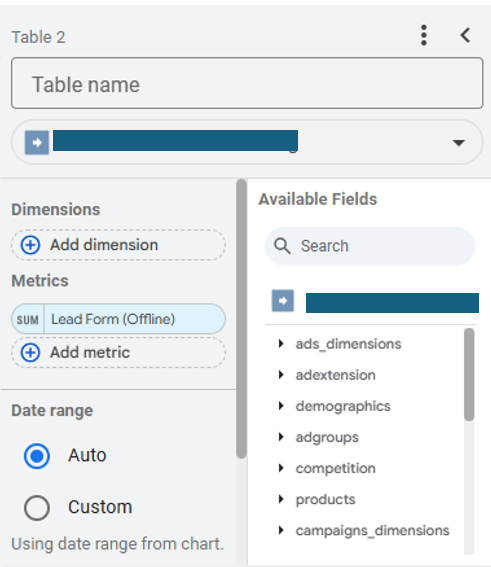
Once the filter is applied, the metric now counts only the conversion you care about. This is the point to rename the metric in the second table to something meaningful. Here it has been renamed to "Lead form (offline)".
Step 7. Repeat for additional conversions
To report on more than one conversion action, repeat steps 4 to 6 for each additional action: join another copy of the same data source, add the conversions metric, filter it to a single action, and rename it. A blend supports up to five tables in total, so you can isolate several conversion actions in one blended source.
Step 8. Build the table and calculate cost per conversion
You can now drop the blended source into a table in your report and add each of your renamed conversions. That gives you the total figures for each action. To work out the cost per conversion for each one, create a calculated field using the formula below.
IFNULL(
SUM(Total Cost) / IFNULL(NULLIF(SUM(Custom Conversion), 0), 1),
1
)
Total Cost comes from your first (basis) table, and Custom Conversion is the filtered conversion metric you created. Swap in the actual field names for each cost per conversion column you build.
Why the formula is wrapped in IFNULL and NULLIF
The wrappers exist to stop the calculation breaking when a conversion count is zero or missing, which is common at date level. Working from the inside out:
- NULLIF(SUM(Custom Conversion), 0) returns null whenever the conversion count is zero. This is what protects you from dividing by zero, which Looker Studio would otherwise return as an error or a broken cell.
- IFNULL(NULLIF(...), 1) then replaces that null denominator with 1, so the division always has a safe value to work with rather than failing.
- The outer IFNULL(..., 1) catches any null that still slips through and returns a fallback, so every cell in the column shows a clean number instead of a blank or an error.
The result is a table of cost per custom conversion figures, one column per action, with no gaps where a day happened to have no conversions.

Related articles

Andromeda Has Changed Meta Advertising. Here's What That Actually Means.
Read more
Small Budget Ecommerce Brands: How to Make Meta Ads Actually Work
Read moreMeasurement Tools we should be using for Paid Media In 2026
Read more
How to Display Multiple Custom Conversions in a Single Data Studio Table
Read more
Andromeda Has Changed Meta Advertising. Here's What That Actually Means.
Read more